Whether you like it or not, internet marketing is a numbers game.
For the most part, you’d do well to avoid giving guesstimates and hunches THAT much weight in your decision-making — be it in your SEO, PPC, content marketing, or web development efforts. The only problem is, the sheer number of analytics tools and metrics out there can easily turn analysis into paralysis.
Remember, if you want to leverage data to concoct tangible action plans, less is more.
You don’t have to burden yourself with dozens of numbers, percentages, and jargon if you start with a clear goal. And in this post, that goal is to maximize the profitability of your website.
For this, we took the liberty of identifying the crucial metrics or Key Performance Indicators you need to get ahold of.
But before anything else, a quick word about vanity metrics.
What are Vanity Metrics?
In simple terms, vanity metrics are empty, meaningless numbers that can be manipulated to make a strategy appear more successful than it really is.
For example, getting a large volume of traffic on your website — regardless if they’re legitimate or not — doesn’t automatically equate to more profits if they’re not generating conversions. In which case, it’s only a vanity metric that may cause you to be further invested in similar strategies that do little to nothing to your bottom line.
Now that we got that out of the way, it’s time to get to the KPIs that matter if you care about the profitability of your website.
We will use Google Analytics — a free web analytics service — to give an idea of how these metrics are collected and measured.
Let’s get started.
1. Bounce Rate
First off, let’s talk about the KPI that invalidates traffic or page views as a valuable metric.
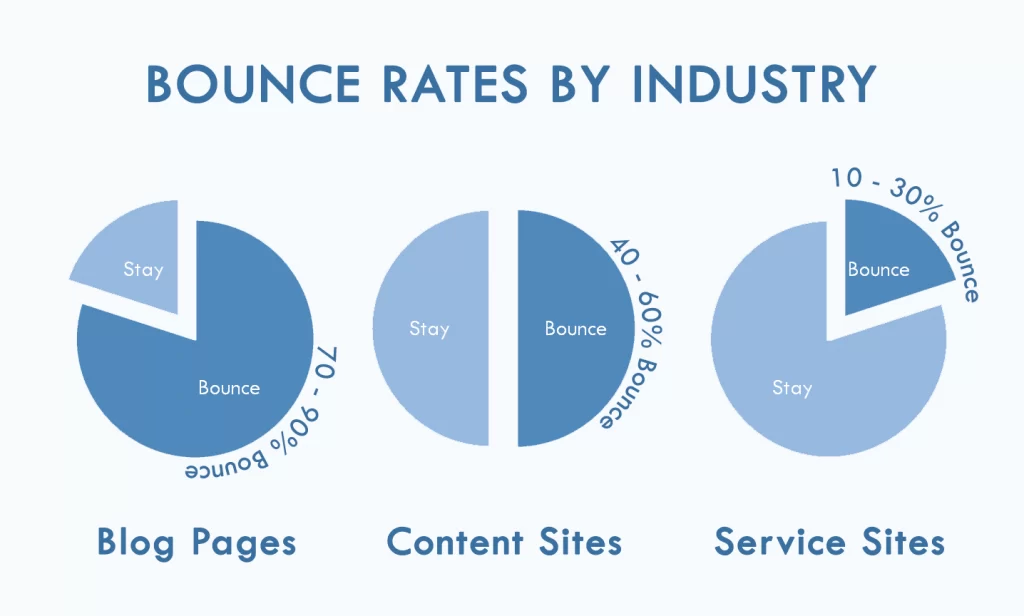
The bounce rate metric is all about the number of visitors who leave your site immediately after viewing only one page. It often indicates a mismatch between the audience’s expectations and the value that your content offers.

Naturally, people who bounce away from your website can’t be turned into subscribers or paying customers. That’s why, if you want to close more sales or generate more leads, you need to track this KPI and identify the underlying factors that affect it.
A slow website, for example, is one of the main reasons why most online users leave websites without clicking anywhere else. According to statistics, up to 40 percent of visitors abandon a site that needs more than three seconds to finish loading.
To reduce bounce rate, use a tool like PageSpeed Insights to identify actionable recommendations that can improve your website’s performance. For e-commerce businesses, consider a Content Delivery Network or CDN to minimize latency and optimize bandwidth utilization.
2. Conversion Rate
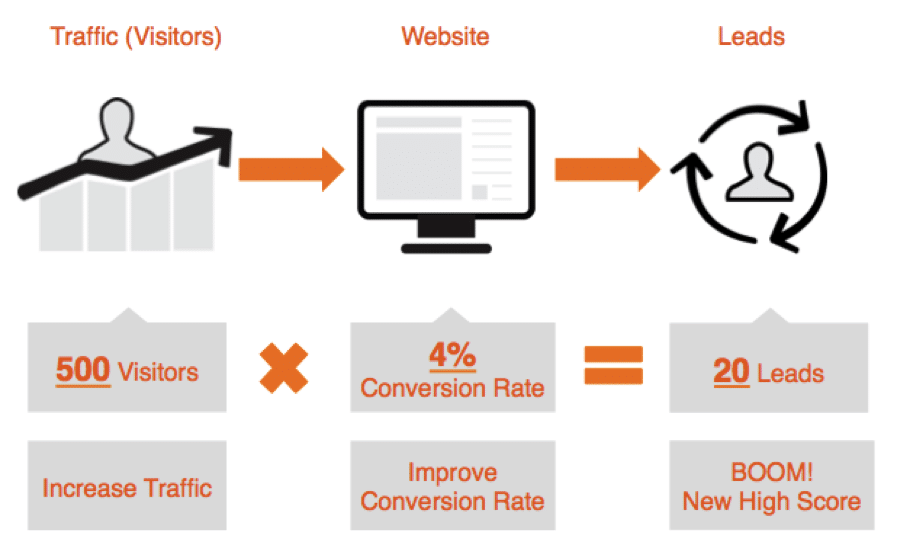
In online marketing, a conversion may pertain to different things.
It could describe users who subscribe to your newsletter, install your mobile app, sign up to your online course, buy your products, and so on.
The good news is, Google Analytics can discern between these different interactions and calculate the conversion rate for each of them.

On the other hand, there’s no one-size-fits-all solution when it comes to a website’s conversion rates. After all, it depends on a variety of on-page elements that are used differently by different sites.
Your best bet is to refine your keyword research and make sure you pull in visitors with buyer intent. These are people who search with commercial or action-based terms, like “buy,” “order,” or “hire.”
3. Number of Positive Reviews
The next metric is something a lot of marketers tend to overlook.
A survey by BrightLocal shows that 85 percent of online users trust online reviews as if they’re actual recommendations from their friends.
As such, you need to have a review generation strategy and the appropriate KPI to measure its effectiveness.
To generate more positive reviews on your websites, some proven tips are:
- Automate a review request email upon purchase
- Incorporate review submission forms into your web design
- Encourage more reviewers by responding constructively to existing posts
Of course, you should also lend an ear to customers or users who leave negative reviews on your website. With the right approach, even negative reviews can be used to find opportunities to provide a better user experience and forge better relationships with your customers.
4. Pages Per Session
As a website owner, you’d want visitors to discover more of your website as much as possible.
The pages per session — as the name suggestions — measures the number of pages a user views in one visit. This is directly tied to ease of navigation on your website as well as how engaging your pages are.

Although a lot of website owners opt for a goal-oriented design and strip pages clean of navigation menus, you can still compel your audience to view more pages through a solid internal linking. This refers to the link building strategy of adding links to other pages within your content’s main body.
5. Traffic Acquisition Channels
It goes without saying that certain promotion channels may work better for you than others.
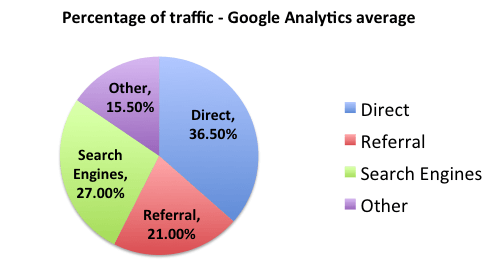
By tracking your top traffic acquisition channels, you can determine which of your marketing tactics yield the most results — allowing you to allocate your budget accordingly, double down on strategies that work, and focus on improving channels that underperform.

On Google Analytics, traffic acquisition channels are divided into five categories:
- Organic search — Traffic acquired from Search Engine Results Pages or SERPs
- Direct — Traffic who entered your website’s URL directly into their browser
- Referral — Traffic acquired through backlinks from other domains
- Social — Traffic originating from social media networks
- Others — Traffic from all other mediums, like newsletters, web feeds, and so on
Conclusion
Having a bird’s-eye view of your website KPIs is a must if you want to make informed, high-impact decisions that lead to profitable results.
Keep in mind that even the most experienced marketers still rely on data to show them how to move forward. It’s only a matter of combing through the numbers and spotting the information that can be put to use.


